In this post, the optimal score that provides the team batting in the first innings the best chance of winning will be analyzed using statistics of matches gone by.
The thought occurred during the India - Australia series in October, 2008. India won the match in Mohali when they made a score of 400+ in the first innings. In Delhi, India made a score of 600+, but the match ended in a draw. At this point, I wondered whether a score of 400 - 500 would be better for the team batting first than a score in excess of 500. Sure enough, though due to idiotic 'tactics' by Ricky Ponting, India won in Nagpur when they made a score of 400 something in the match.
Closer inspection was warranted.
Using
Cricinfo's stats guru, the following data can be obtained.
Team batting first scores 0-100 runs:

The stats show
Win Percentage: 0 / 12 = 0%
Loss Percentage: 11/ 12 = 91.7%
Draw Percentage: 1 / 12 = 8.3%
Team batting first scores 100-200 runs:

The stats show
Win Percentage: 8 / 84 = 9.5%
Loss Percentage: 65 / 84 = 77.3%
Draw Percentage: 11 / 84 =13.1%
Team batting first scores 200-300 runs:

The stats show
Win Percentage: 34 / 127 = 26.8%
Loss Percentage: 75 / 127 = 59.1%
Draw Percentage: 18 / 127 =14.2%
Team batting first scores 300-400 runs:

The stats show
Win Percentage: 33 / 94 = 35.1%
Loss Percentage: 35 / 94 = 37.2%
Draw Percentage: 25 / 94 =26.6%
Team batting first scores 400-500 runs:
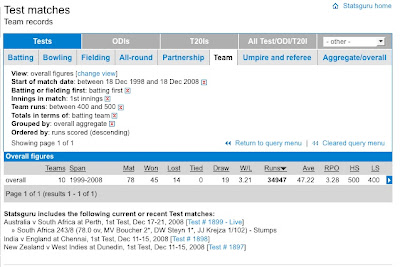
The stats show
Win Percentage: 45 / 78 = 57.7%
Loss Percentage: 14 / 78 = 17.9%
Draw Percentage: 19 / 78 =24.4%
Team batting first scores 500-600 runs:
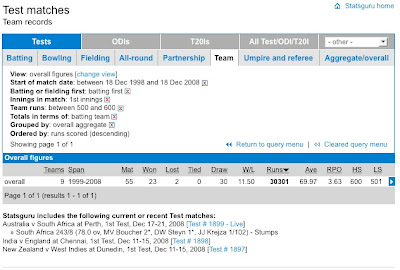
The stats show
Win Percentage: 23 / 55 = 41.8%
Loss Percentage: 2 / 55 = 3.6%
Draw Percentage: 30 / 55 = 54.5%
Team batting first scores more than 600 runs:

The stats show
Win Percentage: 13 / 23 = 56.5%
Loss Percentage: 0 / 23 = 0%
Draw Percentage: 10 / 23 =43.5%
The above records show the split for the matches over the past 10 years only. Considering only the first innings scores, it is clear that teams batting first win more when they score between 400-500 runs (win percentage of 57.7%) followed closely by when they score more than 600 runs (win percentage of 56.5%). Strangely, when the score is between 500-600, the win percentage drops to 41.8%. At the same time, when the score is between 400-500, the loss percentage is 17.9% whereas when the score increases above 500, it decreases dramatically to 3.6% when the scores are between 500-600 and 0% when it is above 600.
This is probably due to several reasons. A score of above 500 could indicate that the pitch is really good for batting making draw very likely. It could also indicate that to make scores of above 500 takes up more time than that required to make a score in excess of 400.
To conclude, if winning -- and not 'not losing' -- is the main objective, teams are better off scoring between 400 and 500 runs rather than more than 500 runs.


